Monitoring Water Quality in the Penobscot River
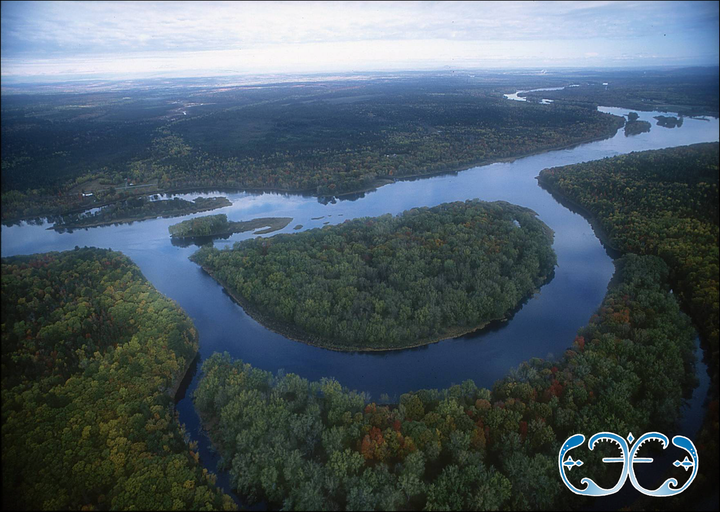
 Aerial View of the Penobscot. The river with the double curve. Photo from Angie Reed
The Pαnawαhpsekewi (people of where the rocks widen), also known as the Penobscot Nation, are deeply connected to their relative, the Pαnawάhpskewtəkok (Penobscot) River. The people get their name from the river with whom they share an identity and for whom they have a responsibility to care and protect. Nə̀pi (water) represents life and their love for the River is deeply personal and rooted in their culture and beliefs. The Penobscot water song describes the foundation of efforts to protect the health and well-being of the Penobscot River relative and an mp3 of the song can be downloaded for free.
The Penobscot Nation’s Water Resource Program (PNWRP) has a mission to “protect, enhance, and restore water quality and aquatic resources, and related aquatic ecosystems of the Nation’s territories so that tribal members may fully carry out tribal traditional cultural practices and lifeways.” A big part of this mission starts with water quality monitoring, data collection and analysis of water samples to assess the health of water bodies. Penobscot Nation has their own water quality standards that were approved by Chief and Council, however because of the Maine Indian Claims Settlement Act of 1980, there are jurisdictional issues that prevent them from getting approved by the Environmental Protection Agency (EPA) which has a trust responsibility to all Native Nations (see “Tribal Sovereignty and the Problem of Difference in Environmental Regulation: Observations on “Measured Separatism” in Indian Country” for background). Consequently, PNWRP primarily compares their monitoring data to the Maine Department of Environmental Protection water quality standards. The most common standards for waters are those for dissolved oxygen and E. coli bacteria.
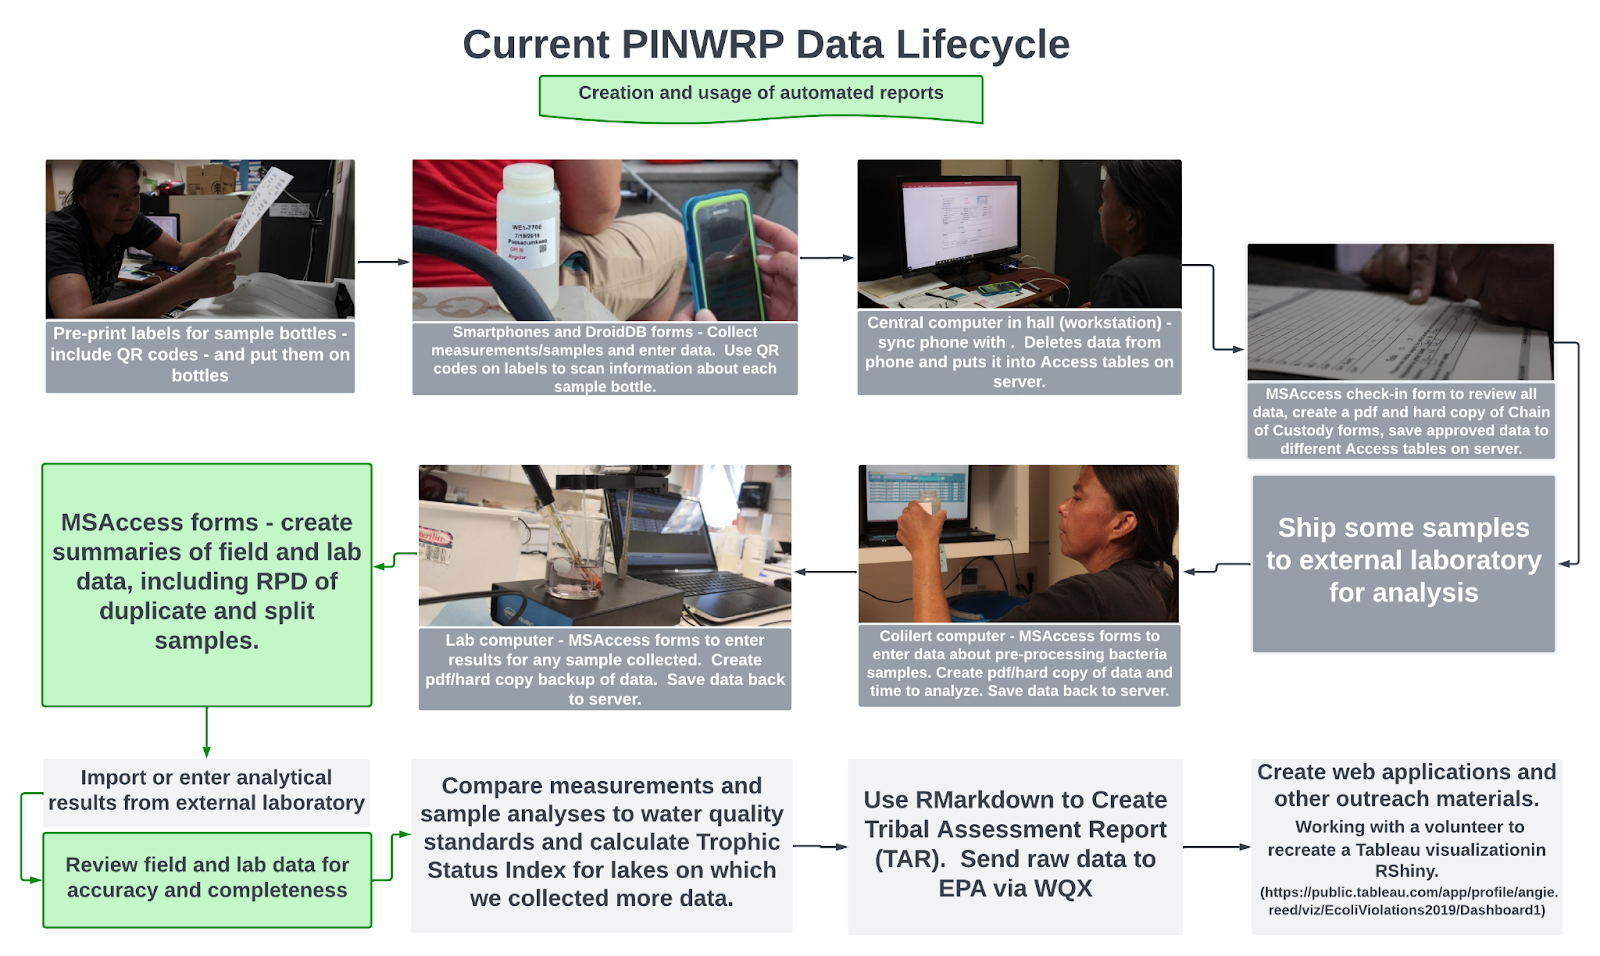
Current monitoring efforts by the PNWRP include the direct measurement and water sample collection at 66 river sites, 47 tributary sites, and 21 sites on 11 lakes. For these, labels with QR codes are pre-printed and added to bottles in advance so that data about each sample can be automatically entered with a smartphone during field work. Numerous variables are measured directly in the field and some water samples are processed in the laboratory. All collected data is downloaded, reviewed and approved and can then be analyzed and used for various purposes. The following diagram visualizes the current data life cycle during this process.

This data is used for a variety of purposes, including:
- general outreach,
- fish consumption advisories,
- dam removal analysis,
- stream temperature modeling,
- water quality reports,
- rulemaking, and
- legislation.
Part 1 - New methodology for water quality control and reports
For this community project, students will work in partnership with the Penobscot Nation Water Resources Planner to help develop a new methodology for compiling and processing water quality data in R. They will strive to create an automated workflow and template to generate field and laboratory summary reports in the form of Quarto documents. These reports will be used internally by the Water Resources Program and are intended to be used for assessment of accuracy and completeness of field and lab results. These reports have been created in Access in the past, and the major goal of this project is to create an R-based workflow.
Field Reports
Some major components of this project are to:
- Flag missing or repetitive data
- Flag data from different attributes that is not consistent with the attribute’s requirements, using the guidelines in the Quality Control Flags document.
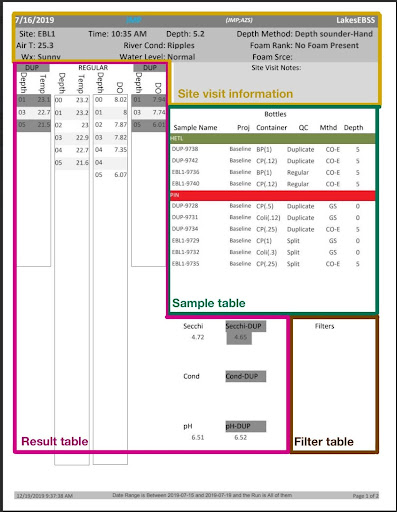
- Create a single file summary report for each primary collector using Quarto. Each file should also be further divided by run and date with headings for each site, and contain the following sections:
- A header section with all relevant site information
- A sample table displaying the information about all bottles collected
- A result table with all measurements taken in the field
- A filter table for any sites that have a chlorophyll a sample collected and is filtered by us
- A summary of flags checked [additional table]
- Create a function to automate the creation of these summary reports by primary collector.
- An example of a previous report and its various sections is presented below to give an idea of the format and information to strive for. More examples of these reports, notably including some filter tables can be found in the Water Quality Project Resources Folder.

Laboratory Reports
Some major components of this project are to:
- Summarize all lab data for a particular year
- Calculate and create columns for violations in:
- Transportation temperature.
- Holding time.
- Analysis time
- Flag data from different attributes that is not consistent with the attribute’s requirements, using the guidelines in the Quality Control Flags document.
- Parametrize and format single file summary reports in Quarto based on constituent, date, and run.
- Create a function to automate the creation of these summary reports.
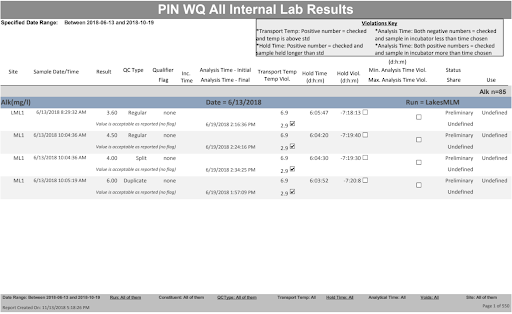
An example of a previous report and its various sections is presented in Figure 3.

Part 2 - E. coli bacteria assessment
Another goal for this community project is to help create a workflow to assess the surface water quality in terms of E.Coli bacteria colonies. In Maine, there are two different sets of regulations in place based on water quality class and type of water body. These criteria necessitate the analysis of the geometric mean of water samples over a 90 days rolling period.
The Maine Department of Environmental Protection (DEP) makes calculations of these rolling averages using a spreadsheet in order to assess if the water bodies meet the water quality standards. Some code has already been developed in the past by the PNWRP to create these 90 days rolling averages in a more automated way. However, results vary depending on the starting day of the rolling average. Thus, further exploration is necessary to determine the most accurate way to create these rolling averages, which may or may not match the process used by DEP but will be compared to it.
Some major goals for this project are to:
- Reformat the DEP data to run it in the previously written 90 days rolling average script from the PIN water quality team. This E.Coli DEP data is a document that can serve as the starting point of extracting the DEP data from DEP Calculations to allow it to run in the E.Coli code already written. It might be necessary to simplify the code to only include the variables that are available in the DEP data.
- Compare the results of that process to the results from the DEP calculations. If results are different, modify the code from the script to make the results match.
- Explore the differences in results when starting the rolling average on different days (Eg: starting the rolling average on the sampling day).
- Explore the differences in results when creating the 90 days rolling average backwards. (Eg: starting the rolling average 90 days before the last sampling day).
- Investigate how the results are influenced by these different starting points. The ultimate goal is to understand what the variability in results means to propose an optimal technique for choosing when to start the rolling average.
- Explore how the results change over a 90 days period based on the number of water samples collected. The ultimate goal is to figure out if there is an optimal number of samples to collect and use in this process.
What skills you can expect to learn
- Workflow creation for inputting water quality data and comparing it to established standards.
- Water quality report formatting and creation using Quarto
- Automation of report creation
- Project report writing using RMarkdown
- Knowledge exchange including documenting and sharing coding knowledge with community partner
- Teamwork and troubleshooting skills to contribute to the achievement of the community partner project goal
Data
Access the project on github and find out more about the data in the codebook.
Resources
Water Quality Project Background
- Article: Native American and Other Experts Monitor Penobscot Watershed in Maine
- StoryMap: Tribal Nations & Exchange Network
- Water Quality Project Resources Folder
Bacteria Regulations
- 2018 / 2020 / 2022 Integrated Water Quality Monitoring and Assessment Report: see p57-63 for Bacteria Criteria for Fresh, Estuarine and Marine Waters.
- Maine Legislature for Penobscot River E. coli analysis
Quarto Resources
- Hello Quarto Tutorial: Great introductory video on how to optimize and navigate a source Quarto document and render it to a variety of output formats.
- Guide to Quarto: Comprehensive guide to using Quarto.
- R for Data Science (2e): Quarto: Quarto basics and overview
- Building a reporting infrastructure with Quarto: Tips for efficient reporting infrastructure creation
- How to use Quarto for Parameterized Reporting: Example of parameterizing a report and connecting it to a database
- Quarto Q&A: How to have labels and captions for an unknown number of tables?: Blog post with code for automatic labels and captions for multiple tables in Quarto.
- Creating tables with gt().
Acknowledgements
Special thanks to Delphine Demaisy ‘26 for putting together the project description and compiling the codebook and field report template in Quarto.